BlackBerry Ltd. (BBRY) was downgraded by TheStreet’s Quant Rating servicetoday so naturally we looked at the charts and indicators. BBRY made a big percentage rally in April and May but prices peaked in late May/early June and our indicators have turned lower.
It is interesting how two different schools of security analysis can point traders and investors in the same direction. Let’s check out the latest charts to see if BRRY is going to give back most of its spring advance.

SMALL INVESTMENT, BIG POTENTIAL. TheStreet’s Stocks Under $10 has identified a handful of stocks with serious upside potential. See them FREE for 14-days.
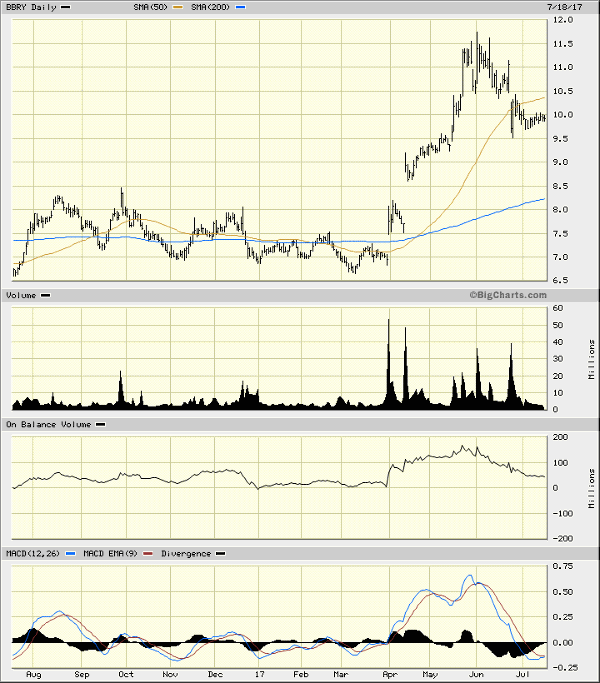
In this daily bar chart of BBRY, above, we can see a low volume sideways consolidation from late July 2016 through March of this year. Prices crossed above and below the 50-day and the 200-day moving averages. The daily On-Balance-Volume (OBV) line was neutral for this same time period and the Moving Average Convergence Divergence (MACD) oscillator spent much of its time below the zero line.
Things changed quickly in late March/early April with prices gaping to the upside on heavy volume. BBRY gaped a second time to the upside in April and a bullish golden cross can be seen in April as the 50-day moving average line crossed above the 200-day moving average line. The OBV line moved higher for two months but turned lower in late May as early buyers turned into sellers. The MACD gave a take profits sell in early June and an outright sell in late June.

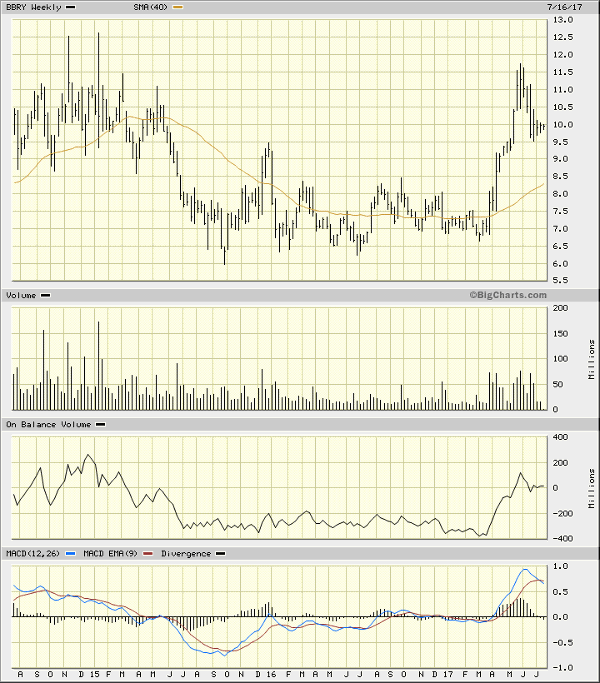
In this weekly bar chart of BBRY, above, we can see that prices are above the rising 40-week moving average line. The weekly OBV line was strong and the MACD oscillator on this time frame has generated a sell signal.

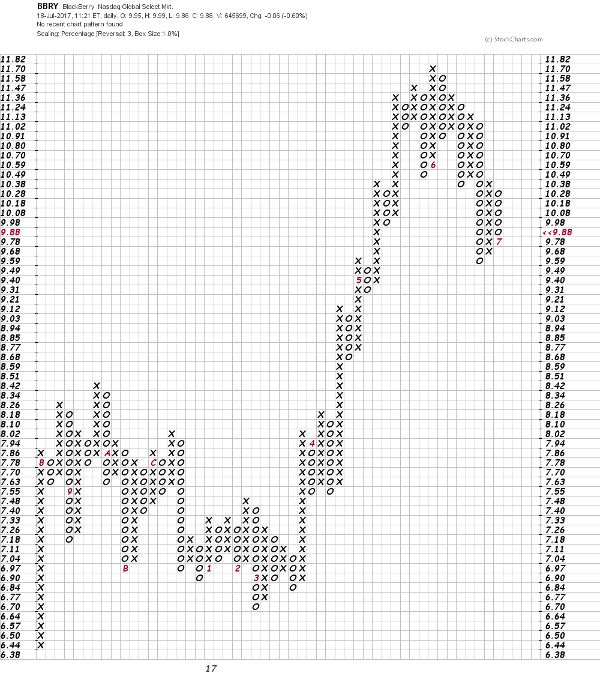
In this Point and Figure chart of BBRY, above, we can see how prices rallied and have peaked. Weakness to $9.49 is likely to precipitate further declines.
Bottom line: A quantitative downgrade and weak charts tell me to avoid the long side as the April-May rally could be given back. BBRY could return to the top of the trading range around $8.00.
The markets may be unpredictable, but Jim Cramer can show you how to navigate it like a pro. Follow his blue-chip portfolio of stocks at Action Alerts PLUS. Join today and try it for 14 days—FREE!
Click here to sign up for Quant Ratings, where you can read our full report on BBRY or more than 4,000 other stocks that our service rates in real time every market day. However, please note that our Quant Ratings service assesses stocks using a proprietary computer model that runs a variety of factors through quantitative and technical analysis. Ratings do not necessarily reflect the opinions of Jim Cramer or other columnists, who may use different criteria to grade stocks.
(This article originally appeared at 12:39 ET on Real Money, our premium site for active traders. Click here to get great columns like this from Bruce Kamich, Jim Cramer and other writers even earlier in the trading day.)
More of What’s Trending on TheStreet:
- Sears Continues on Path to Close All Its Stores — Here Are 50 Reasons the Company Is Dying
- Alpha Rising: Carly Fiorina on Leadership, Micro Financing and Her Only Regret
- Walmart Needs to Buy Costco So That Amazon Doesn’t Run It Over: Ex-Amazon Exec
- Millennials Are Making This Huge Mistake When Buying a Home, Say HGTV’s ‘Property Brothers’
- Honda Finally Makes a Cool-Looking Accord Sedan Because Everyone in America Is Buying SUVs
- 10 Terrible Trading Mistakes That Rookie Investors Keep Making
You see Jim Cramer on TV. Now, see where he invests his money. Check out his multi-million dollar portfolio and discover which stocks he is trading. Learn more now.
[“Source-thestreet”]


